| UI Image |
|---|
| imageUrl | /cdn-cgi/image/w=1700,h=250,fit=crop,f=auto/https://wiki.fluxpunkt.de/download/attachments/41123980/fluxpunkt-wiki-header-images.jpg |
|---|
| height | 200px |
|---|
|
| SP Horizontal nav group |
|---|
| SP Horizontal nav item |
|---|
| | Bereich |
|---|
| Spalte |
|---|
Powerful Business Intelligence and Call Data Analysis.| Awesome Icon |
|---|
| color | #78be20 |
|---|
| size | 20px |
|---|
| monospace | true |
|---|
| icon | fa-area-chart |
|---|
|
Interaktive Callboards mit Drill-Down- und umfangreichen Filterfunktionen
| Awesome Icon |
|---|
| color | #78be20 |
|---|
| size | 20px |
|---|
| monospace | true |
|---|
| icon | fa-paper-plane |
|---|
|
Live-Streaming von STARFACE Anrufdaten, Agenten-Informationen und Call-Events in Power BI Dashboards
| Awesome Icon |
|---|
| color | #78be20 |
|---|
| size | 20px |
|---|
| monospace | true |
|---|
| icon | fa-database |
|---|
|
Zusammenhänge erkennen durch Anbindung weiterer Unternehmensdatenquellen
| Awesome Icon |
|---|
| color | #78be20 |
|---|
| size | 20px |
|---|
| monospace | true |
|---|
| icon | fa-file-text |
|---|
|
Optional: Kundenindividuelle Erstellung von Berichten
| Awesome Icon |
|---|
| color | #78be20 |
|---|
| size | 20px |
|---|
| monospace | true |
|---|
| icon | fa-code |
|---|
|
Automatisierungsfunktionen (über Microsoft Flow)
| Awesome Icon |
|---|
| color | #78be20 |
|---|
| size | 20px |
|---|
| monospace | true |
|---|
| icon | fa-bell |
|---|
|
Push-Notifications und Email-Benachrichtigungen bei Ereignissen
| Awesome Icon |
|---|
| color | #78be20 |
|---|
| size | 20px |
|---|
| monospace | true |
|---|
| icon | fa-pie-chart |
|---|
|
Unzählige Visualisierungsfunktionen
| Awesome Icon |
|---|
| color | #78be20 |
|---|
| size | 20px |
|---|
| monospace | true |
|---|
| icon | fa-globe |
|---|
|
Zugriff von Überall, per Desktop, Web oder App
| Awesome Icon |
|---|
| color | #78be20 |
|---|
| size | 20px |
|---|
| monospace | true |
|---|
| icon | fa-share |
|---|
|
Export Ihrer Daten in PowerPoint, Excel, SharePoint und Websites
| Awesome Icon |
|---|
| color | #78be20 |
|---|
| size | 20px |
|---|
| monospace | true |
|---|
| icon | fa-heartbeat |
|---|
|
Datenschutz und Funktionserhalt: Fluxpunkt Module "telefonieren nicht nach Hause" und sind nicht von der Funktion/Erreichbarkeit externer Lizenzserver abhängig.
| Auszug |
|---|
Insight Analytics liefert Ihnen tiefe Einblicke in die Welt Ihrer Kommunikationsdaten und ermöglicht Ihnen, diese mit unzähligen weiteren Datenquellen (z.B. aus ERP und CRM-Systemen) zu verbinden. Live-Daten von Agenten und Warteschlangen werden zu interaktiven Dashboards. Ruflisteninformationen erlauben historische Analysen. |
Durch Verknüpfung dieser Daten z.B. mit Verkaufszahlen oder Servicezeiten, erhalten Sie schier grenzenlose Informationen über die Effizienz Ihrer Mitarbeiter oder Umsatzwahrscheinlichkeiten einzelner Kunden. Beantworten Sie damit Fragen nach dem Umsatz je Gesprächsminute, bezogen auf einzelne Anrufer, der Wirtschaftlichkeit von Serviceverträgen, dem Servicelevel Ihrer Agenten und vieles mehr! Auf Basis von Microsoft Power BI stehen Ihnen alle Informationen aus Anrufen für Analysezwecke zur Verfügung: - Anrufer (Name, Caller ID, Rückrufnummer, Account,...)
- Angerufener oder angerufene Gruppe (Agent, Gruppe, Account,...) sowie für Annahme/Nichtannahme verantwortlicher Agent oder Beantwortung durch Heranholen des Anrufs
- Angemeldete Agenten je Gruppe
- Agentenstatus (Nachbearbeitung, Präsenzinformationen,...)
- Zeitpunkt des Anrufs und der Rufannahme
- Klingeldauer
- SLAs
- Anrufdauer
- Rufergebnis
- Leitung
- und vieles mehr
Neben der Auswertung historischer Informationen mit umfangreichen Filtermöglichkeiten, werden Live-Daten der STARFACE für die Visualisierung von Dashboads bereitgestellt. Insight Analytics enthält standardmäßig bereits umfangreiche vorgefertigte und interaktiv nutzbare Dashboards und Berichte. Die Erstellung kundenindividueller Dashboards und Berichte ist möglich. |
| Spalte |
|---|
| 
| Bereich |
|---|
| Spalte |
|---|
| Unterstützte Plattformen:    |
| Spalte |
|---|
| Verfügbare Sprachen:    |
| Spalte |
|---|
| UVP (netto): ab 1.200 € |
|
| UI Button |
|---|
| icon | star |
|---|
| title | Jetzt kaufen |
|---|
| url | https://wiki.fluxpunkt.de/display/FPW/Module+bestellen |
|---|
|
| UI Button |
|---|
| icon | download |
|---|
| title | Download |
|---|
| url | #InsightAnalytics-Losgeht's:Installation |
|---|
|

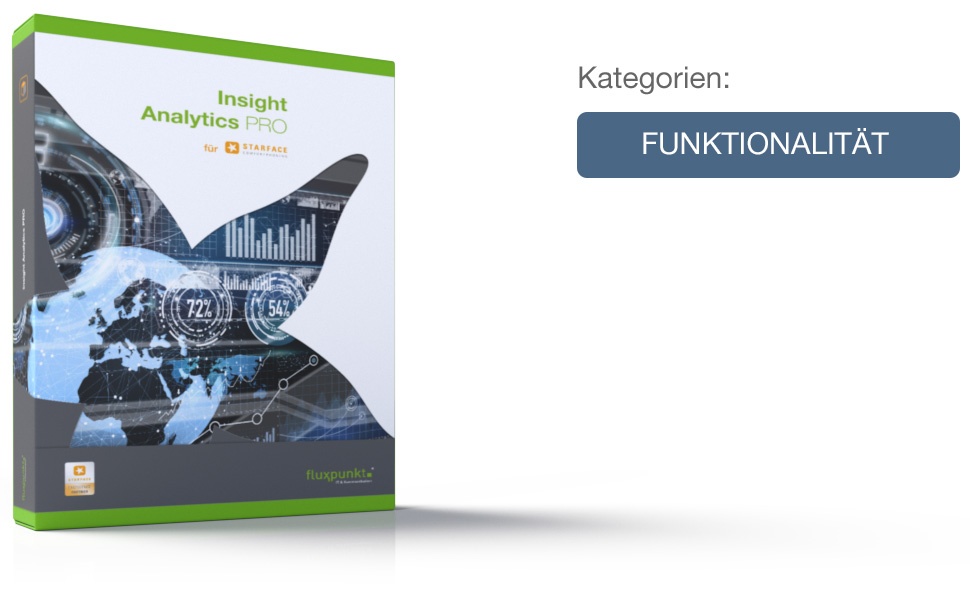
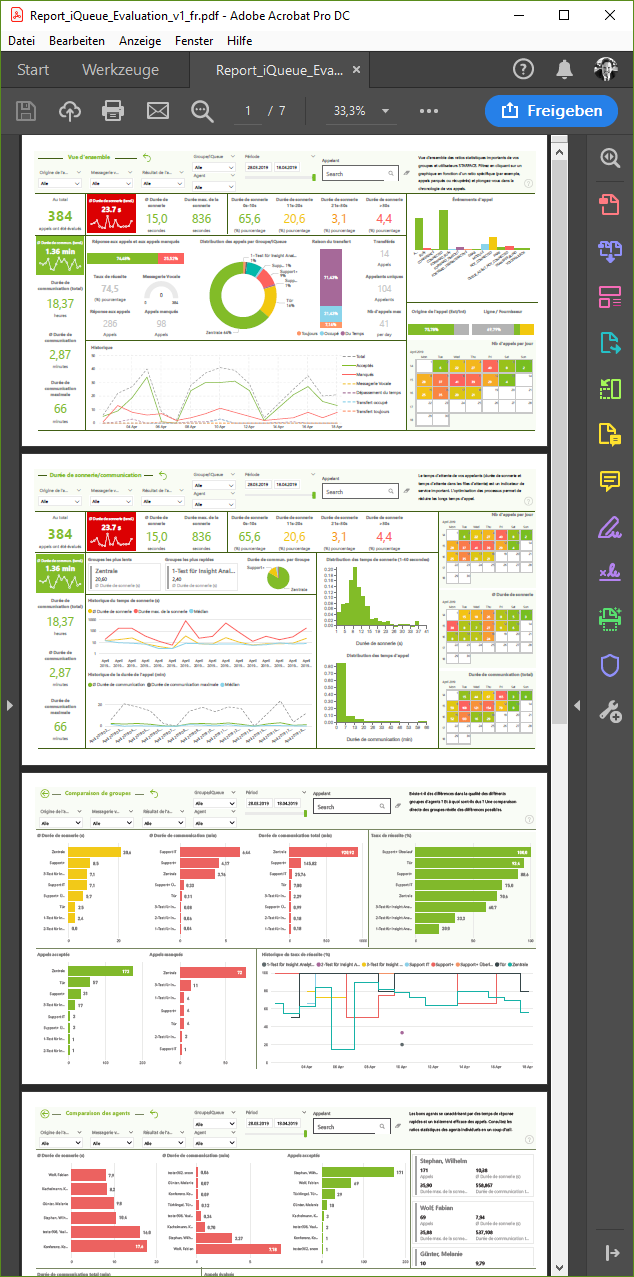
Beispiel: Insight Analytics – umfangreiche und optisch ansprechende Berichte
Powered by:
| UI Image |
|---|
| imageUrl | https://wiki.fluxpunkt.de/download/attachments/41123980/powerbi.png |
|---|
| width | 170px |
|---|
| height | 40px |
|---|
|
|
|
Interaktive Beispiel-BerichtseitenTesten Sie im Folgenden eine Auswahl von anonymisierten Beispielberichtseiten! Klicken Sie auf das Inhaltsverzeichnis ("<1 von 9>") um eine Übersicht der verfügbaren Berichtseiten zu sehen. Blättern Sie vor und zurück und bewegen Sie die Maus über die Anzeigeelemente um Details zu erfahren. Klicken Sie in die Anzeigeelemente um nach Gruppen oder Benutzern zu filtern oder verwenden Sie die globalen Filterelemente in der Kopfzeile um Filter für alle Berichtseiten auf einmal zu definieren. | Iframe |
|---|
| Height | 800px |
|---|
| Width | 100% |
|---|
| Url | https://app.powerbi.com/view?r=eyJrIjoiNDY1ZDdlZGMtNmU5Zi00MWQ5LWFiNTktYjc0OGIxNjEyYTQxIiwidCI6IjFlNzJlYjU1LTk1MDgtNGM3ZS1iMzI1LTNhNjE0MDE0MmRlMyIsImMiOjl9 |
|---|
| Name | Beispiel-Bericht |
|---|
|
Gründe für Fluxpunkt Insight Analytics für STARFACE
| Bereich |
|---|
| Spalte |
|---|
| Die Alternative für umfangreiche Visualisierungs- und AnalyseanforderungenBei Fluxpunkt sind wir der Meinung, dass es nicht sinnvoll ist, das Rad neu zu erfinden oder Produkte zu entwickeln, die lediglich das tun, was andere bereits leisten – es sei denn, wir können es wirklich besser machen und dem Kunden dadurch einen echten Mehrwert bieten. Wir sind bestrebt, nicht nur eine, sondern die beste Lösung für ein Problem zu finden. Aus diesem Grund entschieden wir uns für Microsoft Power BI als Basis für die Analyse und Visualisierung großer Datenmengen, Erzeugung von Reports, Erstellung interaktiver Dashboards und insbesondere die Anbindung an externe Datenquellen wie SQL-Datenbanken oder Excel-Sheets. Mit Insight Analytics für STARFACE und Microsoft Power BI erhalten Sie das Power-Tool für Ihre Visualisierungsanforderungen – ob für Live-Dashboards, historische Analysen oder die Verknüpfung mit beliebigen anderen Datenquellen. Mit Hilfe selbstdefinierter Ansichten und Filter läßt sich der maximale Informationsgehalt aus Ihren Daten herausholen. |
| Spalte |
|---|
|  |
|
| Bereich |
|---|
| Spalte |
|---|
| 
|
| Spalte |
|---|
| Dashboards und Berichte erlauben Ihnen Drill-Downs um so noch tiefer in hierarchische Daten abzutauchen. Per Drill-Through können Sie sich sogar auf die Daten eines einzelnen Kunden oder Lieferanten konzentrieren um so den Fokus auf die Auswirkungen dieses Kunden/Lieferanten auf das Gesamtsystem zu bestimmen. Wählen Sie aus einer Vielzahl von visuellen Elementen die aus, die Ihre Daten optimal und verständlich visualisieren. Die Anordnung einzelner Elemente auf einer Dashboardseite ist vollständig anpassbar. Verschiedene Dashboards unterteilen Ihre Daten themenbezogen. Interaktive Elemente, wie Filter, Schieberegler für Zeitabschnitte oder Dropdown-Felder für die Auswahl von Gruppen, Warteschlangen oder Agenten erlauben Ihnen, schnell den maximalen und relevanten Informationsgehalt zu erfassen. Durch die tiefe Integration in Microsoft Office und die Microsoft KI Services steht Ihnen neben Visualisierungen zusätzlich (bei entsprechender Freigabe) auch Cortana für die Beantwortung von Fragen zu Ihren Kennzahlen zur Verfügung! Und selbstverständlich sind die Visualisierungen an Ihr Corporate Design anpassbar. |
|
| Bereich |
|---|
| Spalte |
|---|
| Im Web, auf dem Desktop oder als AppStellen Sie sich vor, Sie wären immer auf dem Laufenden! Immer informiert, über die Performance Ihres Teams oder aktuelle Kennzahlen Ihres Vertriebs!
Durch die servicebasierte Architektur von Power BI sind die Auswertungen und Analysen von Insight Analytics an beliebigen Orten in Echtzeit verfügbar. Ihre Auswertungen können Sie für Berichte in SharePoint Online oder PowerPoint einbetten – oder in Ihre Website. Immer griffbereit – out of the box! Anwendungsbeispiele- Bereitstellung von Live-Statistiken (z.B. SLAs) für Auftraggeber/Kunden
- Live-Information für Kunden bezüglich der aktuellen Auslastung von Support-/Bestellhotlines.
- Einbettung in Intranet-Portale als Live-Bericht
|
| Spalte |
|---|
|  |
|
| Bereich |
|---|
| Spalte |
|---|
| 
|
| Spalte |
|---|
| ... und auch im UCC-ClientIhre Daten immer im Blick: Auch innerhalb der UCC Kommunikationszentrale, dem STARFACE UCC-Client, haben Sie Zugriff auf die für Sie wichtigen Informationen. Betten Sie Ihre Dashboards und Live-Kacheln in UCC-Client-Fenster ein und platzieren Sie sie nach Ihren Wünschen. So haben Sie nicht nur Ihre Queues im Blick, sondern auch alle für Sie relevanten Daten, wie Anruferstatistiken, Auslastung der Kollegen und Ihre Zielvorgaben. Ach ja – selbstverständlich sind auch im UCC-Client die eingebetteten Informationen interaktiv nutzbar! Der Anordnung Ihrer Visualisierungen sowie der Darstellungsart sind hierbei kaum Grenzen gesetzt. So können verschiedenen Benutzern verschiedene Dashboards bereitgestellt werden und ihnen so die für sie relevanten Informationen angezeigt werden. Supervisor können beispielsweise viel umfangreichere oder andere Statistiken angezeigt bekommen als einfache Agenten. |
|
| Bereich |
|---|
| Spalte |
|---|
| 
|
| Spalte |
|---|
| Exportierbar als PDF, CSV oder PowerPoint-PräsentationExportieren Sie die optisch ansprechenden Berichte per Mausklick in verschiedene Zielformate, wie zum Beispiel PDFs. Oder Sie drucken beeindruckende grafische Aufbereitungen unter Berücksichtigung aktueller Daten und gesetzter Filter einfach aus. PDF-Exporte eignen sich so hervorragend für die Weitergabe Ihrer Auswertungen an Auftraggeber – zum Nachweis Ihrer Performance und Servicelevel-Kennzahlen. Hierfür erlaubt Ihnen Insight Analytics das automatische Ersetzen der Namen Ihrer Agenten und Anrufer durch Pseudonyme oder auch die vollständige automatische Anonymisierung. Exportierte CSV-Daten lassen sich in Excel weiterverarbeiten oder von nachgelagerten Prozessen automatisiert auswerten. |
| Spalte |
|---|
| 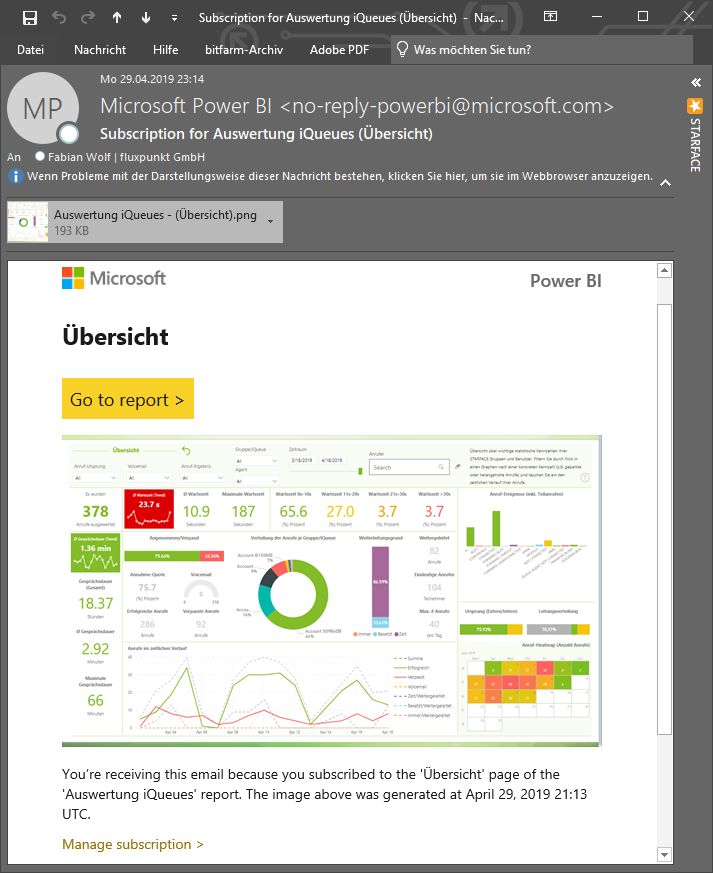 Regelmäßiger Empfang von E-Mail-BerichtenSie können einzelne Berichtsseiten oder Dashboards abonnieren um so regelmäßig und automatisiert per Email auf dem Laufenden gehalten zu werden. Die Berichtsemail enthält den gewählten Bericht als Grafik sowie einen Link um die interaktive Berichtsseite aufrufen zu können.
|
|
| Bereich |
|---|
| Spalte |
|---|
| 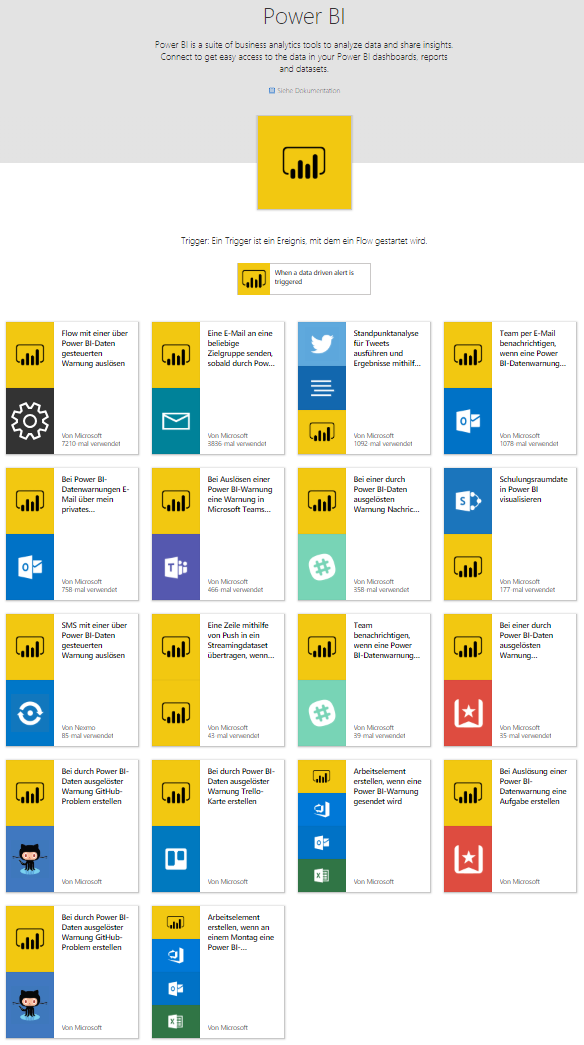 Built-In Automation Built-In AutomationDaten können nicht nur visualisiert oder analysiert werden, sondern auch automatisch – bei Über- oder Unterschreiten definierter Sollbereiche – Warnungen generieren. Ein derartiges Event, kann wiederum eine Vielzahl weiterer Vorgänge auslösen und Sie so z.B. per Push-Notification benachrichtigen, wenn es Zeit wird, zusätzliche Agenten für Ihre Queues bereitzustellen. Sie können zum Beispiel - beliebige Flows auslösen
- eine Email versenden
- Nachrichten in Microsoft Teams oder Slack-Kanäle posten
- SMS versenden
- Wunderlist-Aufgaben oder Trello-Karten erstellen
... oder auch bei externen Ereignissen zusätzliche Daten in die Datasets von Insight Analytics einfügen. 
|
|
Vorteile- Intuitiv: vorgefertigte und leicht verständliche Berichte bereits enthalten
- Mächtig: Beinahe grenzenlose Analysemöglichkeiten der von STARFACE erfassten Daten
- Investitionsschutz: keine Abhängigkeit von externen Lizenzservern
Los geht's: Installation| UI Steps |
|---|
| | UI Step |
|---|
Modul für Ihre STARFACE-Version herunterladen
Dieses Modul ist kompatibel mit STARFACE Version 6.7.3. | UI Button |
|---|
| icon | download |
|---|
| title | für STARFACE 6.7.3 (v20201006) |
|---|
| url | https://wiki.fluxpunkt.de/download/attachments/41123980/Insight_Analytics_v20201006.sfm?api=v2 |
|---|
|
| Erweitern |
|---|
| title | Downloads für ältere Versionen anzeigen... |
|---|
| | UI Button |
|---|
| icon | download |
|---|
| title | für STARFACE 6.6–6.7.1 (v20200218) |
|---|
| url | https://wiki.fluxpunkt.de/download/attachments/41123980/Insight_Analytics_v20200218.sfm |
|---|
|
| UI Button |
|---|
| icon | download |
|---|
| title | für STARFACE 6.6.0.20–6.7.0 (v20190718) |
|---|
| url | https://wiki.fluxpunkt.de/download/attachments/41123980/Insight_Analytics_v20190718.sfm?api=v2 |
|---|
|
|
|
|
| Seite einschließen |
|---|
| _Includes-Questions? |
|---|
| _Includes-Questions? |
|---|
|
|
| SP Horizontal nav item |
|---|
| | Seite einschließen |
|---|
| FPW:Dokumentation: Insight Analytics |
|---|
| FPW:Dokumentation: Insight Analytics |
|---|
|
|
| SP Horizontal nav item |
|---|
| FAQ| Seite einschließen |
|---|
| FPW:Support / FAQ : Insight Analytics |
|---|
| FPW:Support / FAQ : Insight Analytics |
|---|
|
|
| SP Horizontal nav item |
|---|
| | Bereich |
|---|
| Spalte |
|---|
| Kompatibilität / Updates | Modulversion | Kompatibel mit STARFACE Version |
|
|---|
| 20190430 | 6.6.0.20 | Release | | 20190503 | 6.6.0.20 | - Verbesserte Bereinigung von ungültigen Ruflisteneinträgen bei angenommenen Anrufen auf iQueues/Gruppen
- Weitergeleitete Anrufe werden nicht mehr mehrfach gezählt, wenn diese mit dem selben Weiterleitungsgrund mehrfach weitergeleitet wurden
| | 20190522 | 6.6.0.20 | - Bug Behebung: Es konnte passieren, dass einzelne Anrufe nicht in Power BI hochgeladen wurden
- Einschränkung der Analyse auf eingehende Anrufe auf iQueues und Gruppen wurde aufgehoben
- Klingel- und Gesprächsdauer auch für ausgehende Anrufe
- Genauere Erfassung von Klingel- und Gesprächsdauer bei Anrufen mit Voicemal-Nachrichten, insbesondere wenn die Voicemail-Nachrichten in der STARFACE vorhanden sind
| | 20190718 | 6.6.0.20 | - Bug Behebung: Die Lizenzierungsfunktion hat bei Cloud Anlagen nicht berücksichtigt, dass diese mit einer großen Menge an Benutzerlizenzen ausgestattet sind.
- Bug Behebung: Nullpointer Exception wegen gelöschter Benutzer- und Gruppenaccounts
| | 20200218 | 6.7.1.14 | - Kompatibilität mit STARFACE 6.7.1.14
| | 20201006 | 6.7.3.11 | - Enterprise-Feature: Upload der bereinigten Daten in eine SQL Datenbank zur Anbindung an Power BI Desktop
- Tageszeiten-Filter
- Erweiterung der Live-Ansicht von iQueues und Agenten
| |
| Spalte |
|---|
| Continuous Integration StatusBuild gegen STARFACE Releases: | Gadget |
|---|
| preferences | planKeys=SM-IA&isConfigured=true&refresh=120&useFavourites=false |
|---|
| author | Fluxpunkt |
|---|
| url | http://ci.fluxpunkt.de/rest/gadgets/1.0/g/com.atlassian.bamboo.gadgets/status/planStatus.xml |
|---|
|
|
|
|
| SP Horizontal nav item |
|---|
| Kauf / Miete (STARFACE 365)| Bereich |
|---|
| Spalte |
|---|
| Insight Analytics PRO | Insight Analytics PRO | Installierte
Benutzeranzahl | Kauf *
UVP netto
(einmalig) | Miete *
mtl / netto
| Forms - Dropdown list |
|---|
| fieldWidth | mediumField |
|---|
| 0_label | 1 Monat |
|---|
| 3_value | 36 |
|---|
| 2_value | 24 |
|---|
| 4_value | 60 |
|---|
| 1_label | 12 Monate |
|---|
| 2_selected | false |
|---|
| 3_selected | false |
|---|
| counter | 5 |
|---|
| label | Mindestlaufzeit |
|---|
| required | false |
|---|
| 1_selected | false |
|---|
| 4_selected | false |
|---|
| multiselect | false |
|---|
| 3_label | 36 Monate |
|---|
| 2_label | 24 Monate |
|---|
| 0_value | 1 |
|---|
| 4_label | 60 Monate |
|---|
| name | Mindestlaufzeit |
|---|
| 1_value | 12 |
|---|
| 0_selected | false |
|---|
|
| Empfohlen für |
|---|
| 1 - 20 | 1.200 € | 92,31 € | | | 21 - 40 | 2.400 € | 184,62 € | | | 41 - 80 | 4.800 € | 369,23 € | | | 81 - 150 | 7.500 € | 576,92 € | | | 151 - 250 | 12.500 € | 961,54 € | | | > 250 | 17.000 € | 1.307,69 € | | | HTML-Format |
|---|
<sup>* Pro STARFACE-Instanz ist außerdem eine (1) Power BI Pro-Lizenz erforderlich (netto 8,40 € / Monat).
Weitere Power BI Pro-Lizenzen werden für Benutzer benötigt, die eigene Dashboards/Berichte anlegen oder administrative Tätigkeiten durchführen möchten.
Die Benutzeranzahl entspricht der in der STARFACE installierten Anzahl an Benutzerlizenzen (PBX Userlizenz oder STARFACE User Light Lizenz). Insight Analytics prüft die in der STARFACE installierten Benutzerlizenzen – deren Anzahl muß kleiner oder gleich der maximalen Benutzeranzahl der Modullizenz sein. Modullizenzen lassen sich in Bezug auf die Benutzeranzahl nicht kombinieren (es kann genau 1 Modullizenz je STARFACE Serverlizenzschlüssel eingesetzt werden).</sup> |
Insight Analytics PRO enthält die zum Kaufzeitpunkt aktuellste Version vordefinierter Berichte/Reports. | Include+ |
|---|
| scrollEditorUrl | https://wiki.fluxpunkt.de/display/FPW/_Includes-SubscriptionPricing |
|---|
| spaceKey | FPW |
|---|
| scrollEditorDisplayTitle | _Includes-SubscriptionPricing |
|---|
| scrollPageId | AC1100070169A4FE405557241582FC5B |
|---|
|
| UI Button |
|---|
| color | green |
|---|
| icon | star |
|---|
| title | Jetzt kaufen |
|---|
| url | https://wiki.fluxpunkt.de/display/FPW/Module+bestellen |
|---|
|
|
| Spalte |
|---|
| Insight Analytics EnterpriseInsight Analytics Enterprise basiert auf Insight Analytics PRO und bietet zusätzlich die Möglichkeit Fremddaten zu integrieren. Außerdem wird die lokale Speicherung und Auswertung der Daten unterstützt, ohne diese in die Microsoft Cloud hochzuladen. Damit entfallen nicht nur die Speicherlimits von Power BI Pro, es ist auch sichergestellt, dass die Daten das Unternehmen nicht verlassen. Für den Betrieb von Insight Analytics Enterprise ist neben Power BI Desktop in der Regel eine lokale SQL-Datenbank sowie unter Umständen ein lokal installiertes Datengateway erforderlich. Je nach Umfang der zu analysierenden Daten und dem vorgesehenen Speicherort kann auch ein Upgrade auf Power BI Premium notwendig werden. Die Anbindung von Fremddaten und lokale Integration wird projektbezogen nach Aufwand angeboten. | Insight Analytics Enterprise | AddOn
(erfordert Insight Analytics PRO) | Kauf*
UVP netto
(einmalig) | Miete *
mtl / netto |
|---|
| Pro PBX-Serverlizenz | 2.900 €
zzgl. Insight
Analytics PRO | Für das Insight Analytics Enterprise AddOn
ist kein Mietmodell verfügbar. | Insight Analytics Lite (bald verfügbar)Insight Analytics Lite richtet sich an Unternehmen, die zwar viele Mitarbeiter, jedoch nur eine geringe Zahl auszuwertender Agenten haben und lediglich rudimentäre Statistiken benötigen – vergleichbar mit einfachen Visualisierungs-Tools anderer Hersteller. Insight Analytics wird für solche Szenarien wie folgt eingeschränkt: - Auswertung für maximal zwei (2) Gruppen oder iQueues und die darin enthaltenen Agenten
- Auswertung nur für eingehende Anrufe auf die ausgewählten Gruppen/iQueues
- Keine Analyse von Anrufereignissen, die die Gruppe verlassen (z.B. Weiterleitungen, Call-Grabbing, Verarbeitung durch Module, etc.)
- Keine Auswertung mehrerer Standorte
- Nur eine Modulinstanz pro STARFACE-Installation (damit nur ein Ziel-Workspace für die Daten)
- Keine kundenindividuellen Berichte
- Keine Upgrademöglichkeit auf Insight Analytics PRO
Insight Analytics Lite eignet sich damit als immer noch mächtigerer Ersatz für andere, für STARFACE erhältliche, Visualisierungslösungen. | Insight Analytics Lite | Je Agent
der auszuwertenden
Gruppen | Kauf*
UVP netto
(einmalig) | Miete *
mtl / netto |
|---|
| 1 Agent | 150 € | Für Insight Analytics Lite
ist kein Mietmodell verfügbar. | Insight Analytics Lite wird in Paketen zu je 5 Agenten lizenziert (= kleinste Stückelung). |
|
| Bereich |
|---|
Versionsunterschiede
| Insight Analytics
LITE | Insight Analytics
PRO | Insight Analytics
ENTERPRISE |
|---|
| Interaktive Berichte | | Awesome Icon |
|---|
| color | #78be20 |
|---|
| size | 20px |
|---|
| icon | fa-check-square-o |
|---|
|
| | Awesome Icon |
|---|
| color | #78be20 |
|---|
| size | 20px |
|---|
| icon | fa-check-square-o |
|---|
|
| | Awesome Icon |
|---|
| color | #78be20 |
|---|
| size | 20px |
|---|
| icon | fa-check-square-o |
|---|
|
| | Anzahl auswertbarer Gruppen/iQueues | | Awesome Icon |
|---|
| color | #78be20 |
|---|
| size | 20px |
|---|
| icon | fa-check-square-o |
|---|
|
| | Awesome Icon |
|---|
| color | #78be20 |
|---|
| size | 20px |
|---|
| icon | fa-check-square-o |
|---|
|
| | Awesome Icon |
|---|
| color | #78be20 |
|---|
| size | 20px |
|---|
| icon | fa-check-square-o |
|---|
|
| | Auswertung aller Anrufe | | Awesome Icon |
|---|
| color | #cc0000 |
|---|
| size | 20px |
|---|
| icon | fa-window-close-o |
|---|
|
| | Awesome Icon |
|---|
| color | #78be20 |
|---|
| size | 20px |
|---|
| icon | fa-check-square-o |
|---|
|
| | Awesome Icon |
|---|
| color | #78be20 |
|---|
| size | 20px |
|---|
| icon | fa-check-square-o |
|---|
|
| Standortübergreifende
Auswertung (mehrere Installationen) | | Awesome Icon |
|---|
| color | #cc0000 |
|---|
| size | 20px |
|---|
| icon | fa-window-close-o |
|---|
|
| | Awesome Icon |
|---|
| color | #78be20 |
|---|
| size | 20px |
|---|
| icon | fa-check-square-o |
|---|
|
| | Awesome Icon |
|---|
| color | #78be20 |
|---|
| size | 20px |
|---|
| icon | fa-check-square-o |
|---|
|
| Mehrere Ziel-Workspaces für Daten
(für gleichzeitige Bereitstellung anonymisierter
und nicht-anonymisierter Daten) | | Awesome Icon |
|---|
| color | #cc0000 |
|---|
| size | 20px |
|---|
| icon | fa-window-close-o |
|---|
|
| | Awesome Icon |
|---|
| color | #78be20 |
|---|
| size | 20px |
|---|
| icon | fa-check-square-o |
|---|
|
| | Awesome Icon |
|---|
| color | #78be20 |
|---|
| size | 20px |
|---|
| icon | fa-check-square-o |
|---|
|
| | Individuelle Berichte | | Awesome Icon |
|---|
| color | #cc0000 |
|---|
| size | 20px |
|---|
| icon | fa-window-close-o |
|---|
|
| | Awesome Icon |
|---|
| color | #78be20 |
|---|
| size | 20px |
|---|
| icon | fa-check-square-o |
|---|
|
| | Awesome Icon |
|---|
| color | #78be20 |
|---|
| size | 20px |
|---|
| icon | fa-check-square-o |
|---|
|
| | Speicherung in lokaler SQL-Datenbank | | Awesome Icon |
|---|
| color | #cc0000 |
|---|
| size | 20px |
|---|
| icon | fa-window-close-o |
|---|
|
| | Awesome Icon |
|---|
| color | #cc0000 |
|---|
| size | 20px |
|---|
| icon | fa-window-close-o |
|---|
|
| | Awesome Icon |
|---|
| color | #78be20 |
|---|
| size | 20px |
|---|
| icon | fa-check-square-o |
|---|
|
| | Auswertung mit Power BI Desktop | | Awesome Icon |
|---|
| color | #cc0000 |
|---|
| size | 20px |
|---|
| icon | fa-window-close-o |
|---|
|
| | Awesome Icon |
|---|
| color | #cc0000 |
|---|
| size | 20px |
|---|
| icon | fa-window-close-o |
|---|
|
| | Awesome Icon |
|---|
| color | #78be20 |
|---|
| size | 20px |
|---|
| icon | fa-check-square-o |
|---|
|
| | Integration von Fremddaten (ERP, WaWi,...) | | Awesome Icon |
|---|
| color | #cc0000 |
|---|
| size | 20px |
|---|
| icon | fa-window-close-o |
|---|
|
| | Awesome Icon |
|---|
| color | #cc0000 |
|---|
| size | 20px |
|---|
| icon | fa-window-close-o |
|---|
|
| | Awesome Icon |
|---|
| color | #78be20 |
|---|
| size | 20px |
|---|
| icon | fa-check-square-o |
|---|
|
| |
Sie sind STARFACE Partner?
Bitte lesen Sie unseren FAQ-Eintrag zum Bestellprozess und Einkaufskonditionen. |
|
|