| UI Image |
|---|
| imageUrl | https://wiki.fluxpunkt.de/download/attachments/41123980/fluxpunkt-wiki-header-images.jpg |
|---|
| height | 200px |
|---|
|
| SP Horizontal nav group |
|---|
| SP Horizontal nav item |
|---|
| | Bereich |
|---|
| Spalte |
|---|
Powerful Business Intelligence and Big Data Analysis.| Awesome Icon |
|---|
| color | #78be20 |
|---|
| size | 20px |
|---|
| monospace | true |
|---|
| icon | fa-area-chart |
|---|
|
Fluxpunkt modules "do not phone home" and are not dependent on the function/accessibility of external license servers.
| Auszug |
|---|
Insight Analytics provides you with deep insight into the world of your communication data and enables you to link it to countless other data sources (e.g. from ERP and CRM systems). Live data from agents and queues becomes interactive dashboards. Call list information allows historical analysis. |
By linking this data e.g. with sales figures or service times, you get almost limitless information about the efficiency of your employees or sales probabilities of individual customers. Use it to answer questions about revenue per call minute, individual callers, the profitability of service contracts, the service level of your agents and much more! Based on Microsoft Power BI , all information from calls is available to you for analysis purposes: - Caller (name, caller ID, callback number, account,...)
- The called or called group (agent, group, account,...) and the agent responsible for acceptance/nonacceptance or answering by picking up the call
- Registered agents per group
- Agent status (postprocessing, presence information,...)
- Time of the call
- Time of call acceptance
- Ringing duration
- SLAs
- Call duration
- Call result
- Used line
- Terminal device information
- and much more
In addition to the evaluation of historical information with extensive filter options, live data from STARFACE is provided for the visualization of dashboards. Dashboards are interactive and can be flexibly assembled and configured. |
| Spalte |
|---|
| 
| Bereich |
|---|
| Spalte |
|---|
| Supported platforms:    |
|
| UI Button |
|---|
| icon | star |
|---|
| title | Jetzt kaufen |
|---|
| url | https://wiki.fluxpunkt.de/display/FPW/Module+bestellen |
|---|
|
| UI Button |
|---|
| icon | download |
|---|
| title | Download |
|---|
|
| UI Button |
|---|
| icon | text |
|---|
| title | Installationsanleitung |
|---|
|
| Iframe |
|---|
| Height | 400px |
|---|
| Width | 485px |
|---|
| Url | https://app.powerbi.com/view?r=eyJrIjoiMjVjYmRiZDctOTA0Yy00NGM1LWI5YjItZmNhN2NkYjE4MzlhIiwidCI6IjFlNzJlYjU1LTk1MDgtNGM3ZS1iMzI1LTNhNjE0MDE0MmRlMyIsImMiOjl9 |
|---|
| Name | Durchschnittliche Gesprächsdauer |
|---|
|
Example: Fluxpunkt Insights - Live information from our STARFACE Powered by:
| UI Image |
|---|
| imageUrl | https://wiki.fluxpunkt.de/download/attachments/41123980/powerbi.png |
|---|
| width | 170px |
|---|
| height | 40px |
|---|
|
|
|
Reasons for Fluxpunkt Insight Analytics for STARFACE
| Bereich |
|---|
| Spalte |
|---|
|  The alternative for extensive visualization and analysis requirements The alternative for extensive visualization and analysis requirements
At Fluxpunkt, we don't think it makes sense to reinvent the wheel or develop products that simply do what others already do - unless we can really do it better and give the customer real added value. We are anxious to find not only one, but the best solution for a problem.
For this reason, we chose Microsoft Power BI as the basis for analyzing and visualizing large amounts of data, generating reports, creating interactive dashboards and, in particular, connecting to external data sources such as SQL databases or Excel sheets. With Insight Analytics for STARFACE and Microsoft Power BI, you get the power tool for your visualization needs - whether for live dashboards, historical analysis, or linking to any other data source. With the help of self-defined views and filters you can get the maximum information content out of your data. |
|
| Bereich |
|---|
| Spalte |
|---|
|  Dashboards and reports allow you to drill down into even deeper hierarchical data. With drill-through, you can even focus on the data of a single customer or supplier to determine the focus on the impact of that customer/supplier on the overall system. Dashboards and reports allow you to drill down into even deeper hierarchical data. With drill-through, you can even focus on the data of a single customer or supplier to determine the focus on the impact of that customer/supplier on the overall system.
Choose from a variety of visual elements to visualize your data in an optimal and understandable way. The arrangement of individual elements on a dashboard page is fully customizable. Different dashboards subdivide your data according to topic. Interactive elements such as filters, slider controls for time periods or dropdown fields for selecting groups, queues or agents allow you to quickly capture the maximum and relevant information content. Due to the deep integration in Microsoft Office and the Microsoft KI Services, Cortana is available to you in addition to visualizations (with appropriate release) for answering questions about your key figures! And of course the visualizations are adaptable to your corporate design. |
|
| Bereich |
|---|
| Spalte |
|---|
|  On the web, on the desktop or as an app On the web, on the desktop or as an appImagine if you were always up to date! Always informed, about the performance of your team or current key figures of your sales!
Power BI's service-based architecture makes Insight Analytics evaluations and analysis available anywhere in real time. You can embed your evaluations for reports in SharePoint Online or PowerPoint - or into your website. Always ready to hand - out of the box! Application examples- Provision of live statistics (e.g. SLAs) for clients/customers
- Live information for customers regarding the current utilization of support/order hotlines.
- Embedding in Intranet portals as live report
|
|
| Bereich |
|---|
| Spalte |
|---|
|  ... and also in the UCC client ... and also in the UCC clientYour data always in view: Even within the UCC communication center, the STARFACE UCC client, you have access to the information you need. Embed your dashboards and live tiles in UCC client windows and place them as you like. So you not only have an overview of your queues, but also of all data relevant to you, such as caller statistics, workload of colleagues and your targets. By the way - of course the embedded information can also be used interactively in the UCC client. |
|
| Bereich |
|---|
| Spalte |
|---|
| Focus on Business IntelligenceImagine you could do far more with your data than just visualize it live in the form of diagrams, lists or tables. Imagine you could ask questions relevant to business management, uncover connections, understand changes and forecast trends. As soon as your STARFACE communication data is available in Power BI, Power BI supports you in finding connections to your other company data.
Sales, earnings, service costs, vacation times, personnel changes - how do these relate to the communication data of individual customers/suppliers?
Do longer conversations really mean higher sales?
Of five customers in the queue, which one has the highest sales probability? Use your data! |
|

| Bereich |
|---|
| Spalte |
|---|
| 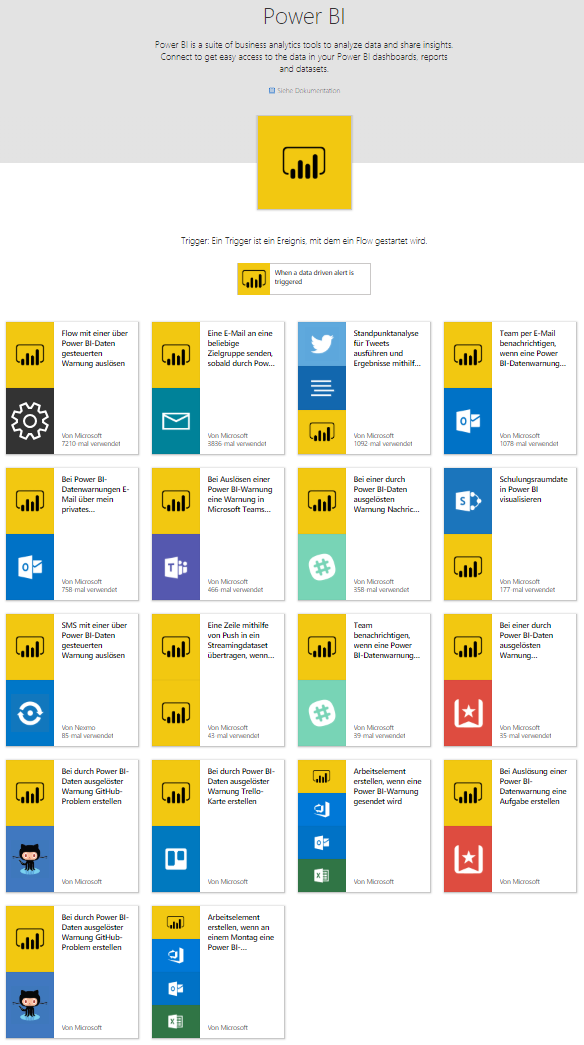 Built-In Automation Built-In AutomationData can not only be visualized or analyzed, but also automatically generate warnings if defined target ranges are exceeded or not reached. Such an event, in turn, can trigger a number of other processes and notify you via push notification, for example, when it is time to provide additional agents for your queues. For example, you can - trigger any flows
- send an email
- post news to Microsoft Teams or Slack channels
- Send text messages
- Create wonder list tasks or Trello cards
... or also insert additional data into the datasets of Insight Analytics for external events. 
|
|
Advantages- Investment protection: no dependence on external services/license servers
Let's go: Installation| UI Steps |
|---|
| | UI Step |
|---|
Download the module for your STARFACE version: | ui-button |
|---|
| icon | download |
|---|
| title | for STARFACE 6.7.3 (v20201006) |
|---|
| url | https://wiki.fluxpunkt.de/download/attachments/41123980/Insight_Analytics_v20201006.sfm?api=v2 |
|---|
|
| Erweitern |
|---|
| title | Downloads für ältere Versionen anzeigen... |
|---|
| | UI Button |
|---|
| icon | download |
|---|
| title | for STARFACE 6.6–6.7.1 (v20200218) |
|---|
| url | https://wiki.fluxpunkt.de/download/attachments/41123980/Insight_Analytics_v20200218.sfm |
|---|
|
| UI Button |
|---|
| icon | download |
|---|
| title | for STARFACE 6.6.0.20–6.7.0 (v20190718) |
|---|
| url | https://wiki.fluxpunkt.de/download/attachments/41123980/Insight_Analytics_v20190718.sfm?api=v2 |
|---|
|
|
|
|
|
| SP Horizontal nav item |
|---|
| | Seite einschließen |
|---|
| Dokumentation: Insight Analytics |
|---|
| Dokumentation: Insight Analytics |
|---|
|
|
| SP Horizontal nav item |
|---|
| FAQ |
| SP Horizontal nav item |
|---|
| | Bereich |
|---|
| Spalte |
|---|
| Compatibility / Updates | Module version | Compatible with STARFACE version |
|---|
| 6.5 | |
|
|
| SP Horizontal nav item |
|---|
| | UI Button |
|---|
| icon | star |
|---|
| title | Jetzt kaufen |
|---|
| url | https://wiki.fluxpunkt.de/display/FPW/Module+bestellen |
|---|
|
Purchasing| Bereich |
|---|
| Spalte |
|---|
| Insight Analytics PRO | Insight Analytics PRO | | Number of users | UVP net * / price per STARFACE installation |
|---|
| 1 - 20 | 1.200 € | | 21 - 40 | 2.400 € | | 41 - 80 | 4.800 € | | 81 - 150 | 7.500 € | | 151 - 250 | 12.500 € | | > 250 | 17.000 € | |
| Spalte |
|---|
| Insight Analytics Enterprise
Insight Analytics Enterprise is based on Insight Analytics PRO and additionally offers the possibility to integrate external data. Insight Analytics Enterprise typically requires a locally installed data gateway and Power BI Desktop. Depending on the amount of data to be analyzed, an upgrade to Power BI Premium may be necessary. The connection of external data and local integration is offered on a project-by-project basis. |
|
* At least one (1) Power BI Pro license is required per installation (net 8.40 € / user per month).
Are you a STARFACE Partner?
Please read our FAQ entry about the order process and purchase conditions. |
|
|